RNA Sequencing (RNA-Seq) Explained: From Gene Expression to Transcriptome Analysis
Discover how RNA sequencing (RNA-seq) reveals gene expression and transcriptome complexity. Explore RNA extraction, library preparation, sequencing, quality control, read alignment, gene quantification, differential expression, alternative splicing, and modern single-cell transcriptomics.
RNA Sequencing (RNA-Seq) Explained: From Gene Expression to Transcriptome Analysis
Every cell contains the same fundamental genetic instructions, but different cells use those instructions in different ways. RNA sequencing helps reveal which genes are being transcribed, how their RNA products are processed, and how gene expression changes across biological conditions.
What Is RNA Sequencing, and Why Does It Matter?
DNA stores the hereditary information of an organism, but its sequence alone cannot describe every activity taking place inside a living cell. A neuron, a liver cell, and an immune cell can share essentially the same genome while performing remarkably different biological functions. One reason is that the types and amounts of RNA produced from their genes differ.
RNA sequencing (RNA-seq) is a high-throughput approach used to investigate RNA molecules in a sample. It can identify expressed genes, estimate transcript abundance, and reveal aspects of RNA processing. Depending on the experimental protocol, RNA-seq can investigate messenger RNA, noncoding RNA, transcript isoforms, or RNA populations from individual cells.
RNA-seq transformed gene-expression research by making it possible to examine thousands of transcripts in parallel without requiring a fixed collection of probes for every target. Unlike an assay designed to measure one predetermined gene, transcriptome-wide sequencing can reveal unexpected patterns and generate new hypotheses about how cells respond to their environment.
Definition: The transcriptome is the collection of RNA molecules expressed by a cell, tissue, or organism under particular conditions and at a particular time. It is dynamic rather than fixed.
For example, researchers studying a plant exposed to drought may compare its transcriptome with that of a well-watered plant. RNA-seq can reveal changes in RNA abundance associated with water transport, stress signaling, and metabolism. These changes do not automatically establish the underlying mechanisms, but they provide clues about the pathways involved.
How Gene Expression Creates a Dynamic Transcriptome
Gene expression begins with transcription, the process by which an RNA polymerase synthesizes RNA using DNA as a template. In eukaryotic cells, many protein-coding genes initially produce precursor messenger RNA. Processing events can include removal of introns, joining of exons, addition of a 5′ cap, and formation of a 3′ poly(A) tail.
Importantly, one gene does not always produce one RNA molecule. Alternative splicing can combine exons in different arrangements, generating transcript isoforms that may differ in structure, regulation, stability, or coding potential. Alternative transcription initiation and polyadenylation can create additional transcript diversity.
Cellular RNA populations also include ribosomal RNA, transfer RNA, microRNAs, long noncoding RNAs, and many other RNA classes. Each category has different biological functions. A sequencing experiment must therefore be designed around the RNA population of interest.
| RNA type | Principal role | RNA-seq relevance |
|---|---|---|
| mRNA | Encodes proteins | Frequently studied to quantify protein-coding gene expression |
| rRNA | Structural and catalytic component of ribosomes | Often depleted in total RNA-seq to increase coverage of other RNAs |
| lncRNA | Diverse regulatory and other cellular roles | Investigated in suitably designed total RNA-seq experiments |
| miRNA | Small RNA involved in post-transcriptional regulation | Typically requires specialized small-RNA library preparation |
This molecular diversity explains why there is no universal RNA-seq protocol. Capturing polyadenylated messenger RNA emphasizes one portion of the transcriptome, while protocols based on ribosomal RNA depletion can retain additional RNA species. The resulting datasets answer overlapping but not identical biological questions.
From RNA Extraction to Sequencing Libraries
RNA-seq begins with a biological specimen, such as cultured cells, plant tissue, blood-derived cells, or a microbial population. RNA is extracted and assessed for quantity, purity, and integrity. RNA degradation can alter the representation of transcripts and complicate interpretation, particularly when comparing samples prepared under different conditions.
In many conventional short-read workflows, selected RNA molecules are converted into complementary DNA (cDNA) using reverse transcriptase. Sequencing adapters are incorporated into a library, and appropriate fragmentation, amplification, and cleanup steps are performed according to the protocol. The resulting library contains molecules suitable for sequencing.
Library preparation is not simply a technical preliminary. Choices involving poly(A) selection, ribosomal RNA depletion, strand specificity, fragment length, and amplification influence the range of transcripts represented in the final dataset. Two laboratories examining the same specimen with different library strategies may consequently detect somewhat different RNA populations.

Once sequencing is completed, each library generates many individual reads. At this point, the experiment moves from molecular preparation to computational biology, where the central challenge becomes reconstructing meaningful information from large numbers of sequence observations.
RNA-Seq Data Quality Control and Read Alignment
RNA-seq data commonly arrive in FASTQ files containing nucleotide sequences and associated quality scores. Before estimating expression, researchers inspect read quality, adapter content, sequence composition, duplication patterns, and possible contamination. These checks help identify technical problems that could influence downstream measurements.
After suitable preprocessing, reads must be connected to their likely transcript or genomic origins. Reference-based workflows use either alignment to a genome or assignment against a transcript reference. Genome aligners designed for RNA-seq must account for exon-exon junctions, because mature RNA molecules may contain sequences separated by introns in the genome.
Approaches based on transcriptome indexing can estimate transcript abundance efficiently without performing conventional base-by-base genomic alignment for every fragment. These strategies have different strengths, assumptions, and output structures. The appropriate method depends on whether the goal is gene-level quantification, transcript-level estimation, splice analysis, or discovery of previously unannotated RNAs.

Important distinction: A high mapping rate does not, by itself, guarantee that an experiment is biologically reliable. Sample identity, library complexity, reference quality, contamination, and experimental design must also be considered.
From Sequencing Reads to Gene Expression Counts
Once reads have been assigned to genes or transcripts, computational methods summarize the evidence as expression measurements. A gene-level count matrix typically contains genes as rows, samples as columns, and counts representing assigned sequencing fragments. This matrix provides the foundation for many statistical analyses.
Raw counts cannot generally be compared between samples without accounting for differences in sequencing depth and RNA composition. Appropriate normalization helps distinguish biological changes from technical differences between libraries. For some purposes, transcript length is also relevant because longer transcripts may produce more fragments under a given sequencing design.
Several expression measures are encountered in the literature. Raw counts support count-based statistical models; TPM is useful for describing length-adjusted relative transcript abundance under suitable conditions; and transformed or normalized values can support visualization. These measures are not interchangeable, and not every one is appropriate as input to differential expression software.
| Measurement | Meaning | Common use |
|---|---|---|
| Raw counts | Reads or fragments assigned to features | Input for count-based differential expression models |
| TPM | Transcripts per million, adjusted for feature length and library composition | Descriptive comparison of relative transcript abundance |
| Normalized counts | Counts adjusted for selected technical effects | Exploration and comparison across samples |
| Variance-stabilized values | Transformed expression values with reduced mean-variance dependence | Clustering, heatmaps, and exploratory plots |
The key scientific principle is that sequencing does not count every RNA molecule in a cell directly. RNA extraction, library construction, molecular capture, amplification, and sequencing introduce sampling and technical effects. Quantification estimates relative abundance within the limits of the assay and analytical model.
Differential Gene Expression Analysis
Differential gene expression analysis asks whether RNA abundance differs between experimental conditions. Examples include untreated versus stimulated immune cells, control versus gene-perturbed cell cultures, or plant tissues collected under contrasting environmental conditions.
Statistical approaches such as those implemented in DESeq2 and edgeR model RNA-seq count data while accounting for biological variability and technical characteristics of sequencing libraries. The experimental design may include treatment, batch, time point, or other relevant variables. Biological replicates are essential for estimating variability and drawing reliable conclusions.
Differential expression results are commonly described using a fold change, a statistical significance measure, and an adjusted p-value addressing multiple testing. A large fold change does not necessarily mean strong evidence if variability is high. Conversely, a statistically convincing but small difference may have limited biological importance, depending on the research question.
Volcano Plot
Displays effect size against statistical evidence, helping researchers identify genes with notable expression changes.
Heatmap
Shows expression patterns across samples and genes, often after normalization and transformation.
Principal Component Analysis
Summarizes major patterns of variation and can help reveal sample groupings, outliers, and possible batch effects.
Imagine an experiment assessing how a signaling inhibitor affects cultured cells. Differential expression might reveal coordinated changes in transcripts associated with the cell cycle. This suggests a biological response worth exploring, but RNA-seq alone cannot establish whether those transcriptional differences directly caused a particular cellular outcome.
Alternative Splicing and Transcript Isoform Discovery
Gene-level expression analysis summarizes many observations into a value for each gene. This is useful, but it can hide differences between transcripts produced from the same genomic region. Two samples may express similar overall amounts of RNA from a gene while producing different proportions of its transcript isoforms.
Alternative splicing, exon skipping, intron retention, and changes in transcript start or termination sites can alter the structure of RNA molecules. Such changes may influence which protein isoforms are produced or how RNA molecules are regulated. Researchers therefore sometimes need transcript-level analysis rather than only gene-level quantification.
Short-read RNA-seq often reconstructs transcript structures from fragmented evidence. This becomes challenging when several isoforms share most of their exons. Long-read sequencing can provide information spanning much larger portions of a transcript, sometimes covering full-length isoforms. However, data yield, error characteristics, coverage, and analysis requirements remain technology-dependent.
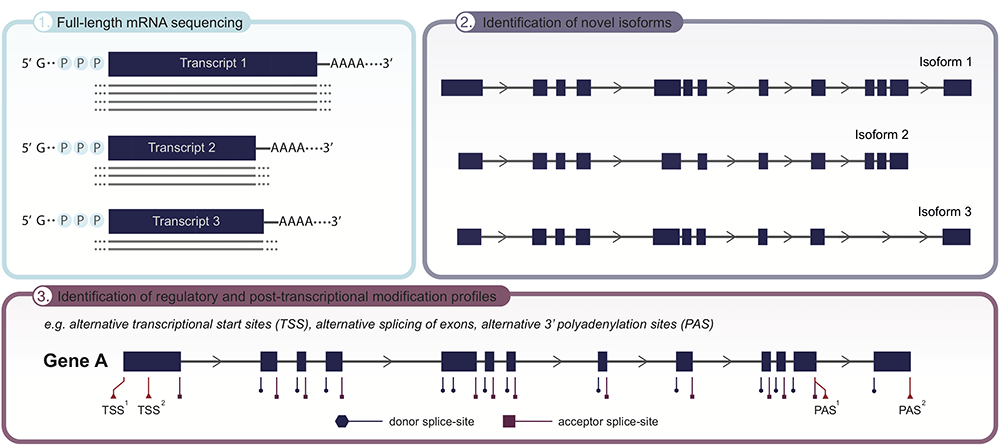
Understanding transcript diversity is increasingly important in molecular research because a gene's biological effects may depend not only on how much RNA is produced, but also on which transcript forms are present and translated.
Bulk RNA-Seq Versus Single-Cell RNA Sequencing
Conventional bulk RNA-seq measures RNA from a population of cells. It provides a valuable summary of the sample's expression profile, but differences between individual cells are combined into an aggregate signal. In a tissue containing many cell types, a change in bulk expression may reflect altered expression within cells, a change in the proportions of cell types, or both.
Single-cell RNA sequencing (scRNA-seq) addresses this limitation by obtaining transcriptomic information from individual cells or nuclei, depending on the protocol. It allows researchers to investigate heterogeneous cell populations, identify rare cellular states, and explore expression differences across cell groups.
Single-cell measurements are typically sparser than bulk measurements and can contain substantial technical variation. Computational processing may include cell and gene quality control, normalization, dimensionality reduction, clustering, cell-type annotation, and analysis of differential expression. The biological sample or donor, rather than the individual cell alone, often defines the independent experimental replicate for statistical comparisons.
| Feature | Bulk RNA-seq | Single-cell RNA-seq |
|---|---|---|
| Resolution | Cell population or tissue sample | Individual cells or nuclei |
| Main strength | Robust analysis of aggregate expression | Investigation of cellular heterogeneity |
| Typical challenge | Cell-type composition can obscure changes | Sparsity, technical noise, and cell annotation |
| Research example | Expression response across tissue samples | Discovery of distinct cellular states |

The choice between bulk and single-cell sequencing should follow the scientific objective. For a carefully controlled experiment asking whether a treatment changes average gene expression, bulk RNA-seq may be appropriate. When a key question concerns which cell populations respond, single-cell approaches may provide information that bulk measurements cannot resolve.
From Differential Expression to Biological Pathways
A differential expression analysis may produce hundreds or thousands of genes with estimated expression changes. The next challenge is to understand whether these genes are related to recognizable biological processes. Functional interpretation connects gene-level results to pathways, molecular functions, cellular components, and known interactions.
Gene Ontology and curated pathway resources can help identify overrepresented biological terms or coordinated changes in gene sets. For example, an experiment involving activated immune cells might identify expression patterns associated with cytokine signaling or cellular metabolism. Pathway analysis organizes those findings into hypotheses about the wider biological response.
However, pathway results depend on the gene annotations, selected statistical background, species, and analysis method. A significant enrichment does not prove that every gene in a pathway is active, nor does it establish a causal mechanism. Carefully selected experiments are needed to test the biological implications.
Research example: Suppose RNA-seq reveals increased expression of transcripts associated with oxidative stress following exposure to a compound. This could motivate measurements of reactive oxygen species, protein activity, or cellular damage to determine whether the transcriptional response corresponds to a functional change.
This connection between RNA measurements and experimental biology is fundamental to trustworthy transcriptomics. Sequencing identifies patterns worth investigating; additional evidence helps determine their significance.
Researchers can explore transcriptomic datasets through NCBI GEO, genomic annotations through Ensembl, and biological pathways through Reactome. These resources support comparison with existing scientific evidence.
How RNA Sequencing Connects to Modern Biotechnology
RNA sequencing has become a foundation of modern molecular research because it allows researchers to investigate how cells respond to genetic, developmental, and environmental changes. Its applications span disease biology, developmental biology, microbiology, plant science, and biotechnology.
In biotechnology, transcriptome profiling can help researchers compare engineered and unmodified biological systems. A microbial production strain, for example, may exhibit changes in expression associated with metabolism, stress responses, or transport functions. Studying these patterns can guide hypotheses for further strain characterization and optimization.
Integration with proteomics and metabolomics can provide a more complete view of biological function. RNA abundance describes one layer of regulation, while protein measurements and metabolite profiles offer complementary information about downstream molecular activity. Combining these datasets strengthens systems-level interpretation.
Emerging long-read, single-cell, and spatial transcriptomic approaches add further dimensions. They enable investigation of transcript isoforms, cellular heterogeneity, and the location of gene-expression patterns within tissues. Advances in computation and machine learning are also expanding how these complex datasets can be analyzed.
The central scientific insight
A genome describes what a biological system can potentially express. RNA sequencing provides evidence about what it is transcribing under particular conditions. Understanding the relationship between these layers helps connect genetic information to cellular behavior, molecular mechanisms, and biotechnology.
RNA-seq is therefore more than a technique for producing gene-expression tables. It is a means of asking how biological systems use their genetic information, why their transcriptional programs differ, and how those differences contribute to the diversity of life.
Scientific References and Further Reading
1. Dawadi P et al. (2025). From bench to bytes: a practical guide to RNA sequencing data analysis. Frontiers in Genetics.
2. Mantere T, Kersten S, Hoischen A (2019). Long-Read Sequencing Emerging in Medical Genetics. Frontiers in Genetics.
3. Chen G, Ning B, Shi T (2019). Single-Cell RNA-Seq Technologies and Related Computational Data Analysis. Frontiers in Genetics.
4. RNA-Seq workflow: gene-level exploratory analysis and differential expression. F1000Research.
5. RNA-seq data science: From raw data to effective interpretation. Frontiers in Genetics (2023).